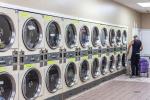
CHICAGO — Further removed from the COVID-19 pandemic and having watched inflation fall over the last two years, many self-service laundry owners and operators had a strong year in 2023.
Based on results from this year’s American Coin-Op annual State of the Industry survey, nearly three-quarters of owners and operators saw their self-serviice laundry business improve last year.
The State of the Industry Survey report provides many statistics valuable to store owners and investors who wish to compare their operations to the industry average. This year’s survey focused on 2023-24 business conditions, vend pricing, equipment, turns per day and utilities cost.
When asked about their 2023 business results, respondents were given the opportunity to state whether their results were up, down or unchanged. (Surveys conducted prior to 2012 asked only if business was up or down, so keep this in mind if you’re making comparisons to results from that period.)
The annual survey is an unscientific, online poll of American Coin-Op readers who operate stores. Some percentages may not equal 100% due to rounding or other factors.
GETTING TO KNOW YOU
Better than two-thirds of respondents polled this year—70.8%—own just one self-service laundry, while the remaining 29.2% are multi-store owners (21.2% own two or three stores, 8.0% own four or more).
For the first time, we asked self-service laundry owners if they considered their involvement in their business to be full-time or part-time. Nearly 44% say their contributions are full-time, 54.0% see it as part-time, and 2.2% say it’s something else (one owner mentioned only handling money and checks, for example, while another described themselves as being semi-retired, with their adult children running the business).
Regarding store size, 28.5% say their largest covers 3,000 square feet or more, 32.1% say it’s between 2,000 and 2,999 square feet, and the remaining 39.4% say it measures 1,999 square feet or less.
Slightly more than 56% of respondents own their store space, 40.9% rent their store space, and the remaining 3.6% say their arrangement varies by property.
Fully attended stores among the audience polled account for 39.4%. Nearly 23% are partially attended, and 33.6% are unattended. Among the remaining 4.4%, the arrangement varies by store.
Nearly 84% of self-service laundry owners surveyed employ either part-time or full-time workers. Within this group, 44.9% have four or more employees, 20.6% employ two or three, and 18.4% have only one employee. Roughly 15% of owners don’t employ anyone beyond those involved in ownership.
On average, laundry owners have 1.7 full-time employees and 3.8 part-time employees (it should be noted that this calculation reflects averages by respondent, not by store).
To compensate their non-management-level attendants, three-quarters of store owners pay them at least $12 an hour (25% pay between $12 and $14.99, 50% pay $15 or more). Approximately 14% pay between $7.50 and $11.99 an hour, and 4.3% pay less than $7.50 an hour. The remaining 3.3% say all of their employees are at the management level.
We asked laundry owners how their washers and dryers are operated, and they identified every payment type that applied. The vast majority—87.6%—offer payment using quarters. Mobile app is next in popularity, offered by 26.3%, followed closely by credit card (25.5%) and laundry (store) card (21.2%). Payment by dollar coin is offered by 8.0%, and a 3.0% share offer “other” payment options, including tokens.
Roughly 45% of respondents offer their customers more than one payment option, compared to 46% last year.
We asked respondents to name which ancillary services their stores offer from a list of 21, plus gave the option to identify others. When each checked their service menu, soap vending was a choice of 84.7%, followed by soft drinks and/or snack vending (70.8%), Wi-Fi access (63.5%), laundry bag sales (59.9%) and drop-off wash-dry-fold service (56.2%).
In terms of popularity, those five choices were also the leading choices in the previous annual survey, with Wi-Fi access jumping from No. 5 to No. 3 this year.
We also asked respondents how they had advertised their store(s) in the last 12 months. They were provided a list of 15 choices plus given the option to identify others. The top five choices were social media (45.9%), store website (40.7%), digital ads (27.4%), signs/banners (25.2%) and in-store promotions (21.5%). They were also the top five one year ago, albeit in a different order.
Roughly 28% of store owners polled say they did not advertise their business in the last 12 months.
You must face some challenges in operating your laundry business today. We asked respondents to choose their biggest operational challenges from a list of nine, plus gave them the option to write in “other” choices; operators were directed to select all that apply. Here are the results:
1. High cost: utilities (67.9%)
2. High cost: new equipment (54.5%)
3. High cost: labor (37.3%)
4. Finding/keeping reliable employees; high cost: maintenance; high cost: rent (tie, 29.1%)
7. Equipment abuse/vandalism (18.7%)
8. Too much competition (5.2%)
9. “Other” (3.7%)
10. Poor industry image (1.5%)
2023 BUSINESS VS. 2022
For 2023, nearly three-quarters of respondents (74.6%) say their overall self-service vended laundry business, in gross dollar volume, increased from that of 2022. By comparison, 71.4% reported increases in the 2022-23 survey.
The average 2023 business increase was 13.9%, up slightly from 13.2% in 2022. Other past average business increases have been 17% (2021), 7.1% (2020), 12.6% (2019), 9.9% (2018) and 9.4% (2017).
Following is a breakdown of 2023 business increases (these figures relate to those reporting increases, not all respondents):
- Operators with a business increase of less than 10%: 25.3%
- Operators with a business increase of 10% to 14%: 27.5%
- Operators with a business increase of 15% or more: 47.3%
Roughly 8% of operators polled faced a decrease in total business (in gross dollar volume) in 2023, which is identical to last year’s survey. Results from previous years showed the following shares: 4% in 2021, 58% in 2020 (the year the COVID-19 pandemic started), 12% in 2019, 8% in 2018 and 10% in 2017.
The average 2023 business decrease was 9.5%, compared to 8.9% reported for 2022. Other prior average decreases were 20.0% (2021), 20.5% (2020), 7.5% (2019), 5.0% (2018) and 6.7% (2017).
Among respondents who reported experiencing decreased business in 2023, the decline was as low as 2% or as high as 20%.
Roughly 17% of respondents say their 2023 business was unchanged compared to 2022 performance.
In Part 2 coming Thursday: Wash-dry-fold, commercial laundry and vending sales results

Have a question or comment? E-mail our editor Bruce Beggs at [email protected].